We are here to answer your questions. No question is too trivial so please feel free to raise questions – that is how we all learn. We have compiled a list of questions that our customers have asked us in the past. If your question is not answered here, please send your questions to support@efundpower.com and we will be sure to get back to you with an answer.
FundPOWER is a web based interactive tool that shows you which funds to buy, which funds to sell, and when.
FundPOWER is a web-based interactive tool that shows you which funds to buy, which funds to sell, and when.
It is a powerful reporting tool to help you manage your own investments in mutual funds and ETFs, with a high likelihood of getting desired returns from your investments, while simultaneously minimizing and knowing the risk you are taking.
- The report contains innovative performance measures of the balance between any fund’s potential return (reward) and potential risk (uncertainty of getting the reward).
- All measures and indications use the latest price and dividend data for mutual funds, as the daily data is crunched automatically, in a cloud based system.
FundPOWER also includes other services to minimize the time required for you to manage your own investments in mutual funds and ETFs.
You also get coaching and education to help you understand and apply the most advanced know-how of Wall Street that is not typically provided to Main-Street. Empowerment is an important weapon for individuals and do-it-yourself investors who wish to manage their own investments confidently. The other weapon is FundPOWER’s accurate, objective and unbiased, information based on the most advanced performance measurement system available in the industry.
Investor Empowerment Inc., the company behind FundPOWER is an investment coaching, investor advocacy and education company. It is not an advisory service, broker or fund company representative, so there is no conflict of interest.
Basic Service: The FundPOWER Basic Report is a useful way to knowledgeably and easily manage your investments in up to two 401k or 403b retirement accounts, or deferred comp accounts offered by your employer. You will require only a few minutes each month or quarter on the FundPOWER web-based tool.
- In the BASIC service, you can maintain up to 2 watch lists of 30 funds each. Most employers offer 15 to 30 funds in the defined contribution (e.g. 401k) plans. Only a few give more choices. Initial learning and start-up time spent is 15 to 30 minutes.
- See the buy/sell indications, and explanations given for each fund in our interactive web-based report. You can then decide which funds to buy or sell.
- Monitor the behavior of your funds every month (or earlier if you like), and see if some funds have changed behavior. You decide which funds to sell from your portfolio, and which funds to buy from the latest report. This takes about 5 to 10 minutes.
- Make changes to your fund selections, once a quarter, if needed. You can trade through your retirement plan phone representative or via the plan website.
Premium Service: In addition to your employer provided retirement account, this service is useful for managing your investments kept in your brokerage account, including IRA, SEP-IRA, Inherited IRA, or after-tax savings accounts. Typical discount brokers useful for maintaining such accounts include ETrade.com, Schwab.com and Fidelity.com.
- The PREMIUM service includes the FundPOWER Basic Report, as described above.
- Additionally, this service includes the FundPOWER Premium Report. This special quarterly report contains a pre-screened short-list of up to 50 funds filtered from a list of 1000 to 3000 noload funds offered by your broker. It makes the selection process easier for you (work off a shortlist of up to 50 funds vs. the entire list of 1000+ funds), while still using the advanced analysis provided by FundPOWER.
- You decide which funds you want to invest based on this special report. Then using our webbased tool, create a portfolio and monitor your selected funds over time. Initial set up and learning takes about 15 to 30 minutes.
- Monitor the behavior of your selected funds, once a month. This takes about 5 minutes.
- You will receive the FundPOWER Premium Report quarterly. Use the quarterly reports to evaluate your portfolio and rebalance it as you see fit (keep the funds that are performing well and replace the funds from your portfolio which show undesirable Risk-Return behavior with new funds from the quarterly report). You can trade through your broker’s phone representative or website.
FundPOWER Strategies: This product is the simplest to use for managing your investments in brokerage accounts such as IRA, Rollover-IRA, SEP-IRA, Inherited IRA, or after-tax savings accounts. You will spend about 5 to 10 minutes each quarter, using the FundPOWER strategy report to trade through your broker.
- This service also includes the interactive web-based FundPOWER Basic Report.
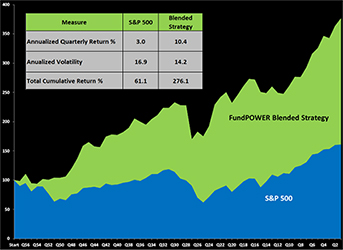
- We provide a choice of 4 strategies: Balanced, Volatility Limited 1, Volatility Limited 2 and Blended. For each strategy, we show you the back tested results for total returns, and risk. The strategies are like investment robots with a difference. Unlike other robot advisors, we do not keep you in the dark. Each strategy shows you the specific funds to invest in while automatically following FundPOWER’s advanced risk-return optimization method.
- You can choose any one strategy that best suits your risk appetite, balanced with your return expectations. The strategy is then applied to the broker list of your choice.
- Each quarter, you will be emailed a FundPOWER Strategy Report containing a list of up to 10 funds that best fit the strategy you have selected. This takes away all the guess work. But if you choose not to strictly follow the list, then you can simply use the strategy report as additional information for you to consider. If you do the latter, your portfolio’s performance might be different from that of the selected strategy. In all cases, the decision is yours.
- Every month your will be emailed a performance report of your FundPOWER Strategies Portfolio.
FundPOWER is the industry leading analysis and portfolio management system specially designed for individual DIY investors who want to manage their investments in mutual funds and ETFs.
FundPOWER empowers you with advanced know-how and education. It gives fact based information that you can act on, such as buy/sell indications and explanations based on advanced methods. It also provides accurate measures of risk, so you can manage your investments being fully aware of the potential impact of uncertainty.
Investment success depends on your know-how and on the information you use to apply the knowhow to buy/sell funds. And of course chance or uncertainty, since investing and markets are based on uncertainty, except when you put money in bank CDs etc.
FundPOWER provides you the first two. It gives buy/sell indications and explanations based on advanced methods, for you to select the right funds for investing. It also empowers you with the advanced know-how and education.
FundPOWER method and performance reports have been rigorously back-tested. Typical results of consistently applying the method can be seen on the Know-How page of this website.
It uses advanced risk-return optimization based on proven Noble Prize winning concepts of MPT (Modern Portfolio Theory) and Efficient Frontier.
- It does not depend on subjective view, guesses or bets on future returns. It has been established time and again, that subjective bets, on the average are no better than “a monkey throwing darts,” to select funds for future investments.
- The advanced risk-return optimization has been used by Wall Street professionals for proprietary money management. For the first time, the same method is being made available to the benefit of Main Street individual investors.
Ratings and performance data generally given to investors depend on past total returns. If these rating and performance data are routinely provided to us with a warning that “…past total returns are not indicative of future performance and should not be used to select funds for future investments”, it’s an insult to our intelligence! If they are not useful, then why do they want us to see them?
- Watch the video tutorial and read the Know-how document.
- Request a free initial consultation about our services and know-how. As you learn, you will understand how the conventional rules-of-thumb and guidance the industry made you believe don’t really work! The easiest way to learn the advanced know-how is by actual practice, and we make it easy for you.
- Start using the FundPOWER service after the free initial consultation.
- Ask questions by e-mail to support@eFundPOWER.com or call us toll free at (800) 308 – 7137
Reward (beyond the guaranteed rate of return, such as from a bank CD, or a U.S. treasury bond) without taking risk, is not possible if you want to invest in the market.
One way to think about, and measure risk is the uncertainty of returns that you might get from a given investment.
As a simple illustration, assume that the potential returns from an investment were to be within a range of +10% to –10% around an average value of 8%. Then the highest return you might get would be 18% (8 + 10), and the lowest value might be -2% (8 – 10). In this example, 10% is the uncertainty of the return that you might actually get, the average potential being 8%. If you are willing to risk living with a return of -2%, while expecting an average of 8%, then the 10% risk of the investment fits your desired risk-return balance.
Generally, in stable and efficient markets of the past, bonds or portfolios consisting of bonds gave lower returns; government treasury bonds gave the lowest returns. And typically their risk was the lowest. As risk increased with stocks and commodities, so did their returns, in general. But in today’s uncertain markets funds or ETFs, consisting of bonds, stocks or commodities might not all behave this way.
While deciding which fund or ETF you want to invest in, you must ensure that the potential average return you might get is balanced with the potential risk or uncertainty of not getting what you had expected. And before deciding to keep or buy a specific fund or ETF, you must also ensure that it has the highest expected return from the available list of funds, for the risk level you are willing to take. This is risk-return optimization.
Since these numbers can only be calculated based on past data, how accurately they are calculated and how they are interpreted will affect your actual investment results. No one can guess and guarantee the future of the market, except someone trained by a Greek Oracle.
Just in case you want to get into details of how values of expected return and related risk are calculated: The average returns expected are measured by the average of daily returns, and the risk or uncertainty is measured by the volatility of daily returns.
And since the risk-return balance of funds and ETFs changes over time as the markets change, you must stay optimized by repeating the process. This is called dynamic optimization.
FundPOWER measures the estimated risk-return balance of all available funds and ETFs as absolute values that are updated daily and also relative to the risk-return of the market. The market is represented by the most commonly used index, the S&P 500. The idea being that if you are willing to take as much risk as the market, you should expect the average return of the market.
FundPOWER provides the latest risk-return values of each fund, and compares them to the market by way of ratings A, B, C and D. These ratings are useful for quick assessment of the relative risk return balance of funds versus the market, and relative to each other. The ratings are represented in 4 quadrants:
A = Higher expected returns, and lower risk than market – The most desired.
B = Higher expected returns, but also higher risk than market – Attractive, but must monitor carefully since the risk is high.
C = Lower expected returns, but also lower risk than market – Safe to have, but note that the returns might not be the most desirable.
D = Lower expected returns, yet higher risk than market – The most undesirable and dangerous. Yet, amazingly, thousands of oblivious investors are sold such funds by the industry, and they are even offered in employer’s retirement plans. FundPOWER is the best and easiest way to avoid such funds!
But the ratings of funds and ETFs change over time. That is why you must monitor monthly.
Persistence Rating is the tendency of the fund to remain in a particular quadrant over a period of time.
Why invest in a fund if its general tendency is to have an undesired risk-return balance or rating, even if its current risk-return balance appears to be desirable? Let’s say, you find 2 funds that have current desirable recent ratings of either A or B. But one fund has shown a generally high tendency to be rated as C or D, while the other fund has shown a generally high tendency to be rated as A or B. Which fund would you like to invest in?
Persistence ratings available in FundPOWER reports provide a valuable way of avoiding funds that are not consistently managed for their risk-return balance. Investing in funds that don’t have high persistence ratings for the desired risk-return behavior is like a “wild goose chase.”
If you choose funds with good persistence ratings for desired risk-return balance, then monitoring monthly or quarterly is sufficient. But if the market becomes very choppy, or starts dropping, or you hear of some special news or change of fund manager, then it’s good to look more often.
You might find that generally, buying new funds, or selling old ones, once a quarter as indicated in the FundPOWER report is sufficient to keep the risk-return balance of your portfolio well optimized.
According to the FundPOWER method, rebalancing means retuning or re-adjustment of your portfolio to maintain its original, desired risk-return balance. Doing this quarterly is generally sufficient.
Say a portfolio initially contains two “A” rated funds with high estimated return and low risk, relative to market. Over time, one fund’s balance becomes undesirable, and its rating becomes “D,” for some reason. To maintain the original, desired risk-return balance, you will need to sell this fund, and buy another fund with acceptable risk-return balance, say another “A” or “B” rated fund. This is a, simple, objective, data driven way of re-balancing, following the FundPOWER method.
Another thing with the FundPOWER method is to keep equal weights of funds in your portfolio, as you re-balance quarterly buying desired funds while selling the undesirable funds. This is because all funds were selected for high likelihood of producing good return in the future, at the risk levels that are acceptable to you.
Of course, you make the final decision. You could always decide to put more money behind one fund versus another, simply because you want to bet on a fund based on your intuition.
The FundPOWER method follows the well proven risk-return balance approach established by Noble Laureates.
You buy a fund at its NAV (price, net of all fees and expenses), and you also sell it at NAV. Hence, expense ratios don’t matter if you keep buying and selling funds quarterly or annually. And as long as the buying and selling increases the net return of your portfolio, why does it matter if the fund management made more money by way of fees, or spent more in operating or marketing expenses?
But expense ratios are theoretically important if you are a passive investor who selects a fund and then passively holds on to it till retirement, even if its risk-return balance becomes undesirable as time goes by. Since all expenses are deducted from the assets held by the fund, theoretically, expenses will reduce the value of the fund, compared to what it would have been if there were no expenses.
Our analysis of more than 25,000 fund symbols over the last 15 years does not indicate a strong relationship between net returns and expenses. In fact, there are several instances when actively managed funds with high expense ratios give high net returns, compared to index funds.
MPT says that at any given level of risk, the maximum return you can get cannot exceed a certain upper limit. It defines the theoretical upper limit of returns possible at different risk levels and the curve joining the highest points on a risk (X-axis) and return (Y-axis) graph is called the Efficient Frontier.
Hence to get the highest return from your portfolio, you must select funds that had given the highest return in the past, for the level of risk you want, meaning that your selected funds should be as close to the Efficient Frontier as possible.
Most funds and ETFs don’t show efficient behavior. Their risk-return balance is far below the Efficient Frontier and correlations of asset classes and market sectors have been changing frequently. FundPOWER will show you hundreds of funds that have higher returns at lower risk, than funds with higher risk.
No past data can predict future returns with 100% certainty. That’s the nature of the market. If future market prices were totally predictable by past returns by way of a formula, trading in markets would cease.
FundPOWER too does not predict future returns. We interpret advanced risk-return performance measures (created and maintained by Investment Risk Management Systems Inc.) based on past daily returns of funds (and not total returns), and the volatility of daily returns. They are used together as a couplet to understand the past risk-return balance of a fund, and draw foresight about its future behavior.
Research of daily returns of almost 25,000 funds over the last 15 years has shown that:
- The risk-return balance of many funds has reasonable persistence in the near future but many funds have frequently changing balance.
- Total returns of funds tend to be higher or lower than market based on their risk-return balance.
- Over long time periods, funds with high average daily returns and lower volatility have higher total returns.
- Funds with higher average daily returns and higher risk also have higher total returns on the average, but have higher risk.
- Low risk low return funds have lower total returns.
- On average, the worst returns are produced by funds that have higher risk than market, yet lower returns.
It would be easy to use, but they don’t work. You are unwittingly forgetting the well known fact “past returns cannot guarantee future performance.”
You are also disregarding the method of portfolio management that is based on well proven concepts of MPT and Efficient Frontier.
See the discussion on Guidance Information in the Insights section.
Fund managers don’t rely on the Morningstar ratings to manage funds or automated models provided to their wealth management divisions. Fund companies and brokers use the ratings only for marketing purposes.
There are three major problems with Morningstar’s method of rating Stars:
- Ratings are specific to funds within each peer group. So a 5 Star fund in one peer group (say technology Stock) might actually have lower returns than a 2 Star fund from a different peer group (say Heath Services), if the latter as a whole performed better than the technology peer group. This makes it impossible to compare funds across peer groups.
- Past total returns over last 1, 3, 5 and 10 years are weighted according to an arbitrary scale to arrive at a number to rank funds, totally disregarding the uncertainties introduced by total returns.
- The risk adjustment formula simply uses a fixed risk-aversion ratio, and an investor does not know if his/her risk aversion is lower or higher than the level used for ranking funds.
We tested data and have summarized below the Morningstar ratings for a sector.
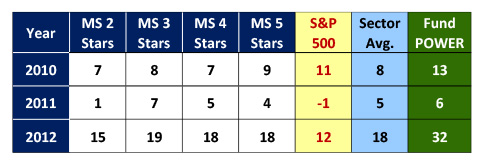
The table show the average returns for each star-rating group (2, 3, 4 and 5 stars), compared to the S&P500, the sector average from MorningStar and the FundPOWER average returns for the same sector. The inconsistencies across the various star groups are apparent. FundPOWER returns are consistently higher than S&P 500 as well as Morning Star sector average.
Guidance tools provided by employer’s retirement plans are based on obsolete rules of thumb that don’t work anymore.
The tools also rely on total returns for past 1, 3, 5 and 10 years. Past total returns are not useful for selecting funds for future investments.
Ratings such as Morningstar and Lipper, based on past total returns, don’t work either.
See the FAQ above and the Guidance discussion in the Insights Section.
It’s a comforting feeling to believe that your employer is looking out for your best interest. The Department of Labor (DOL), under its ERISA rules, expects employers to have fiduciary responsibility to protect the interests of its employees participating in its 401k or other retirement plans.
But most employers, even very large companies, rarely care about retirement plan participants, and rarely care to help employees successfully manage their investments.
The primary goal of most employers is to minimize their costs of offering and operating a retirement plan! The HR department is expected to keep plan operating costs to a minimum!
Most investment committees, who are supposed to approve the funds that are available to employees in their retirement plans, don’t have advanced investment know-how. They simply rely on external consultants, who unfortunately have financial ties with the fund companies whose funds are being included.
The best and only correct way to select specific funds for investment of your 401k or retirement account savings is to optimize and balance their risk and return. FundPOWER shows you how to do this easily and automatically. It also explains how to make the investment decisions, and use advanced know-how that Wall Street and fund companies use successfully for their own investments, but have kept hidden from investors and competitors.
Also see the previous two FAQ’s above.
FOOTNOTE** Names such as Morningstar, Star Ratings and Lipper are trademarks owned by the respective firms. Their references are intended solely within the context of our explanations. **