Basis of Dynamic Portfolio Optimization Method Used by FundPOWER
Traditional vs. New Investment management methods
Traditional Concepts are not wrong but rapid changes in our environment require us to adapt and apply the concepts differently and accurately.
The Modern Portfolio Theory (MPT) and Efficient Frontier concepts were developed by Nobel Laureates and have been the basis for the traditional investment methods for many decades. In the MPT, portfolio performance is defined by two key factors — Risk (uncertainty of return) and Return. The primary focus is to create an optimum risk-return match to an investor’s risk tolerance.
The MPT shows that in efficient, stable markets:
- Higher risk is required to experience higher returns with “efficient portfolios,” and
- Portfolio risk can be reduced by holding diversified (uncorrelated) assets, such as stocks and bonds which are generally uncorrelated over long time periods.
Markets, while never totally efficient, were relatively stable and growing in the middle of and toward the end of the 20th century, and the MPT worked well. As a result, the traditional investment methods worked adequately.
However, markets while continuing to be inefficient are also not as stable any more. The internet age, communications and other technologies, social media, global trade and tourism, all have caused our lives to change like we had never imagined! Today, events in every part of the world impact our lives almost in real time! Our financial markets too are not shielded from global events. Financial markets have moved from being somewhat inefficient and stable to being a lot more inefficient and dynamic. The new world requires all of us to adapt to these changes. Our investment strategies are no exception.
This changing environment requires that we challenge some of the simplified rules of thumb used in traditional investment methods:
- Is high risk necessary to get higher returns?
- Do investments in seemingly diverse asset classes such as bonds and stocks, provide real diversification and optimization?
- Does increasing allocation towards bonds, as investor approaches retirement, and not dynamically as market behavior changes, really work?
- Does selecting specific funds within each asset class, not on the basis of their risk-return balance, but on history of their past total returns and traditional star ratings really work anymore?
- Does a “Buy and Hold,” passive portfolio strategy work anymore?
The new investment method shows that
- high risk is not required to get high returns
- it is important to manage investments dynamically as market behavior changes, and
- active management of investments is necessary to keep an optimal balance of risk and return.
Appling MPT Accurately
At Investor Empowerment Inc., we have applied the new investment method to the world of mutual funds and ETFs. We accurately apply the MPT, to help you choose funds whose risk-return balance is persistently close to the current efficient frontier. These funds have a better chance of performing well in the future. Portfolios created from these funds optimize future returns while keeping risk at levels that investors are willing to accept. Fig. 1 illustrates our basic risk-return performance measures.
Fig. 1
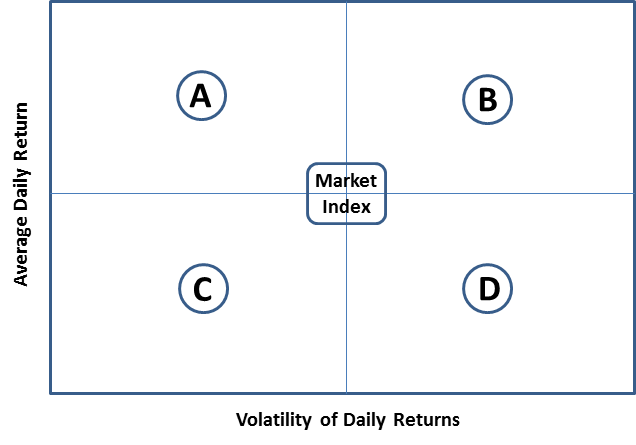
- A = Higher Average Daily Return, and Lower Volatility than Market Index.
- B = Higher Average Daily Return, and Higher Volatility than Market Index.
- C = Lower Average Daily Return, and Lower Volatility than Market Index.
- D = Lower Average Daily Return, and Higher Volatility than Market Index.
Another important measure is the persistence of risk-return behavior of mutual funds. High persistence, indicated by PR-A, PR-B, PR-C and PR-D means higher tendency for a fund to remain with an A, B, C or D rating. In addition to these ratings, we use other risk-return variables and proprietary multi-factor regression coefficients, to analyze historical and current performance of funds. This analysis indentifies funds which have a higher chance of beating the market in the near future.
How does our new method work?
Review Fig. 2. The X-Axis shows Risk and the Y-Axis shows Returns. The solid line is the observed “Efficient Frontier.” Gray dots are actual performance of 30,000+ fund symbols (stock, bond, commodity, conservative, active, passive, domestic, international, index and actively managed funds). Our innovative software is used to create fund ratings, which are used as a starting point for identifying the risk-return behavior of mutual funds. Put in simple terms here is how it works. Out of the universe of funds, let’s look at 4 funds.
Fig. 2
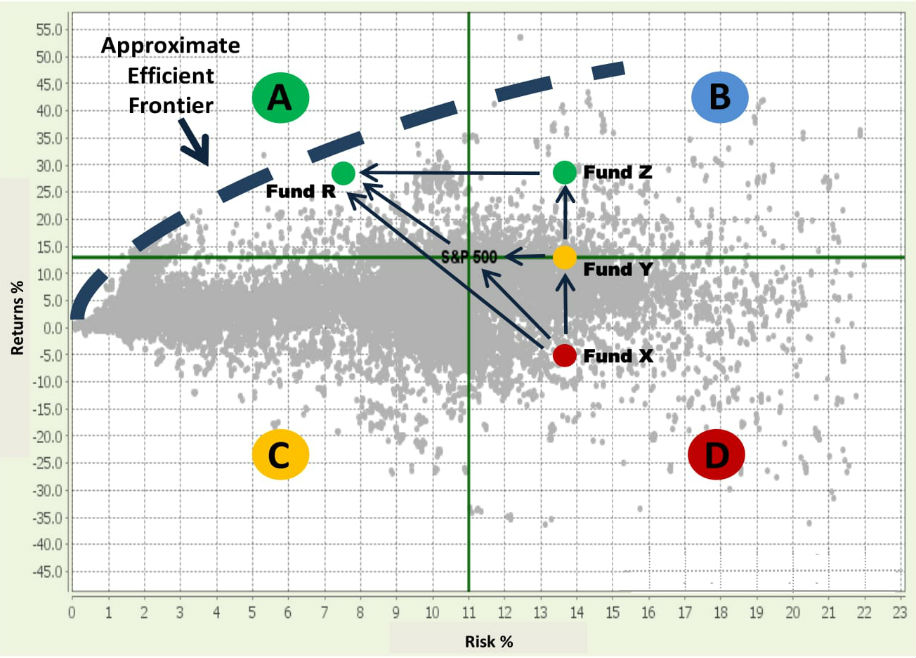
- Fund X, Fund Y and Fund Z, have the same risk. Fund X has the lowest returns and Fund Z has the highest returns of the 3 funds. Therefore, Fund Y is better than Fund X and Fund Z is better than both Fund X and Fund Y, because it gives the highest returns for the given level of risk.
- Fund X has a higher risk and lower return than the S&P500 index, so an S&P index fund is better than Fund X. This is because the S&P index fund can give you a better return while taking less risk than Fund X.
- Fund Y has the same return level as the S&P but has a higher risk. So, you are better off investing in an S&P Index fund because you can get the same return for a lower risk level.
- Fund R is better than S&P index funds and better than Funds X, Y & Z. That is because it gives the best returns at the lowest risk.
You will see in the above example that we constantly are trying to balance the Returns and Risk to get the best funds.
This is easy to do manually with a handful of funds, provided you have accurate Returns-Risk behavior measures. But, when you have 100s or 1000s of funds, and you want to quickly select the right funds, optimize and maintain the risk-return balance dynamically, you need eFundPOWER.
Why do we suggest dynamically rebalancing your fund portfolio?
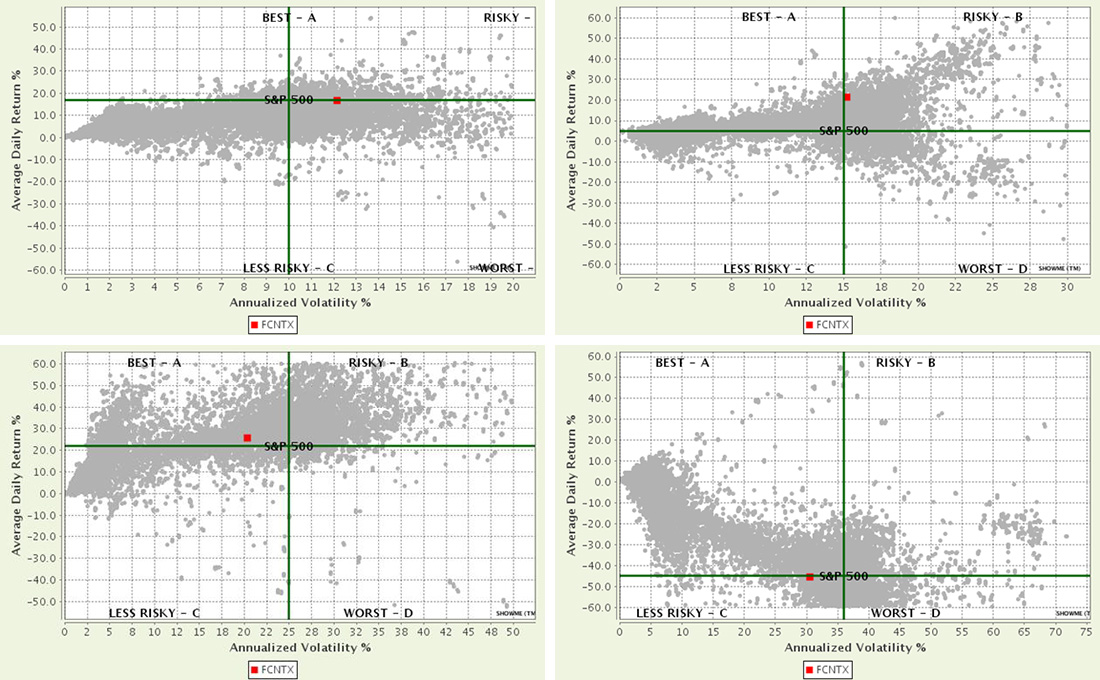
As mentioned above, markets are dynamic and ever changing. This is illustrated in the 4 graphs of Fig. 3. They are snapshots of the mutual fund universe at 4 different points in time within the last 4 years. The funds are obviously performing differently at different times. If investors want optimal returns, then it is important that they take a look at the market and the portfolio regularly, select new funds and rebalance their portfolio as needed.
Fig. 3
Theory is great, but what about the results?
We practice what we preach! In addition to our increasing customer-base, we ourselves follow our method to invest our own hard-earned money. We also have over a 95% re-subscription rate of our active users.
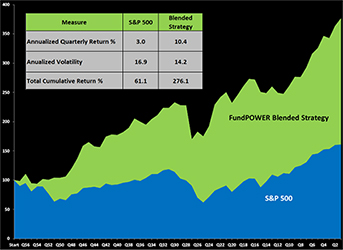
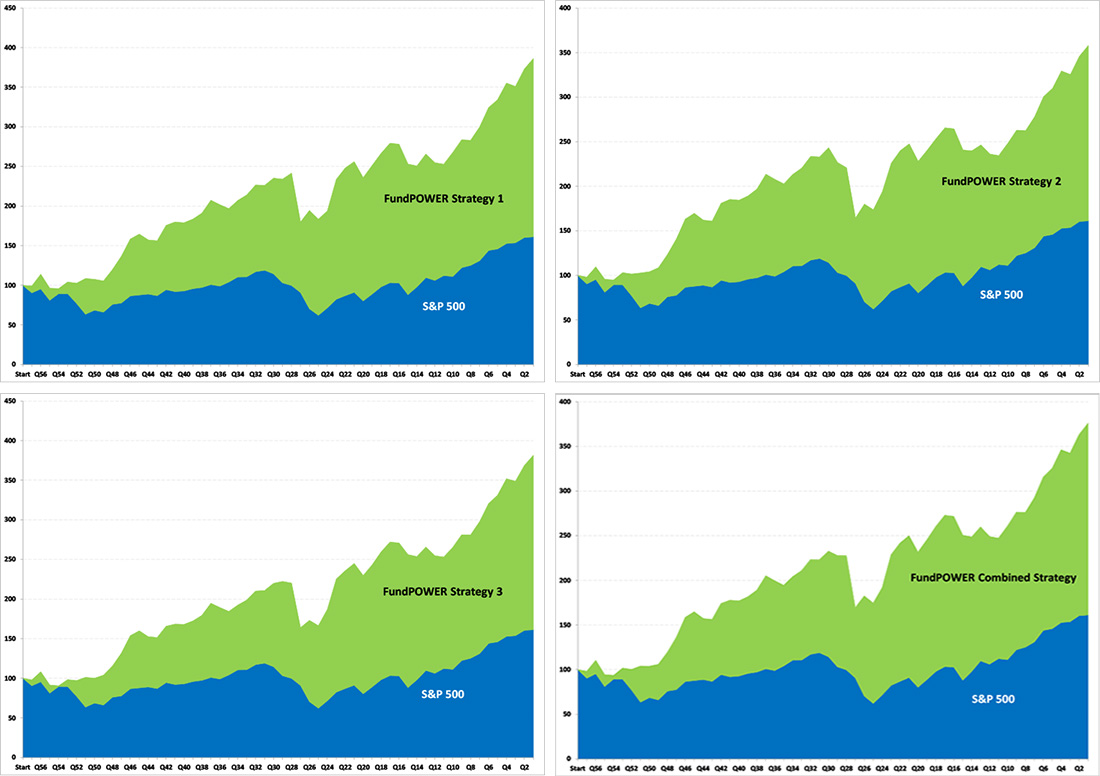
Unlike conventional “robo-advisors,” our investment robots dynamically and automatically optimize risk-return balance of portfolios. The 4 graphs shown below in Fig. 4 demonstrate results produced by our robots (eFundPOWER Strategies).
- Each figure shows the total cumulative returns over 57 rolling quarters, from 2002 through 2015, including dividends declared in the invested quarter, if any. We used this time period so we could capture the 2 worst market crashes in recent history (2002 and 2008).
- Only “no-load” funds were chosen for each investment strategy.
Fig. 4
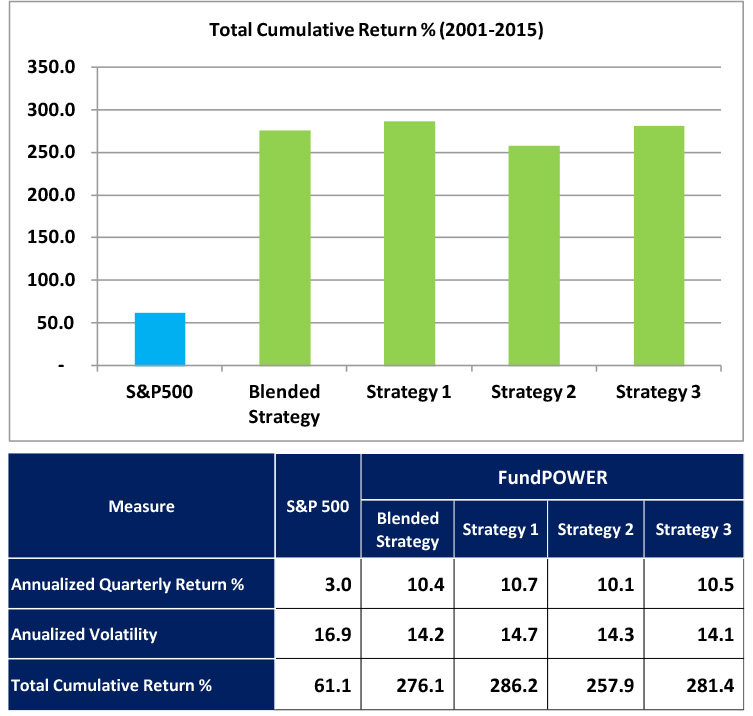
Our robots also control risk. As seen in Fig 5, the risk levels for the IE strategies are slightly lower than the market risk, while their returns are significantly better than the market.
Fig. 5
Let eFundPOWER give you the tools to make your money work for you
To help you regularly rebalance your mutual fund portfolio, eFundPOWER automatically monitors the risk-return characteristics of the funds that you hold in your portfolio. Our reports indicate which funds to hold or buy, and which to sell, to best optimize your portfolio.
Our cloud based system updates calculations daily. Changes in fund performance are observed early, within weeks of the underlying changes in markets, fund strategies, fund manager changes, hot/cold roller coasters of sectors and the overall economy.
In addition to giving the know-how of good investment management, IE, also provides Robotic Investment Portfolios to investors. They are called eFundPOWER Strategies. Funds are automatically added to, or removed periodically from each Robotic Portfolio based on their suitability for each model. Investors can use this powerful information to create, change and manage their mutual fund portfolios.
As you can see, we do the heavy lifting for you and also empower you to manage your own mutual fund investments successfully!
However, just like you need to exercise and eat healthy for your own health (no one can do that for you), you must take active interest in your financial health and manage your portfolios considering buy / sell indications provided by our automated system. Disciplined decisions and actions are critical for investment success.
But remember, results cannot be guaranteed. That’s the nature of the market. And the indications are just that… “indications”. We are not advisors. View us as your investment know-how coaches and informants.